The Civic Protest Barometer (CPB), published by the Dullah Omar Institute on 24 November 2016, measures trends in protest action in South Africa's municipalities. The 2016 CPB tracks trends in the number of protests, the geographical spread of protests, trends in violent civic protest and grievances behind protest action. It reveals chiefly that, against a background of increasing protest action throughout the country, the number of civic (municipal service delivery) protests has decreased significantly. Although civic protests are decreasing, many of them are covering wide areas and lasting a long time. For example, prior to the elections in August 2016, the Vuwani district of Limpopo province saw widespread protests against the re-demarcation of municipal boundaries. Violence continued for several weeks and entailed the destruction of public property, including schools. In effect this was a single protest, albeit one that lasted a long time and covered a massive area.
According to the 2007-2016 CPB, extrapolations from the first six months of 2016 indicate that the number of civic protests will drop significantly this year and contrary to popular belief, there is no apparent direct relationship between an impending election and the number of civic protests.
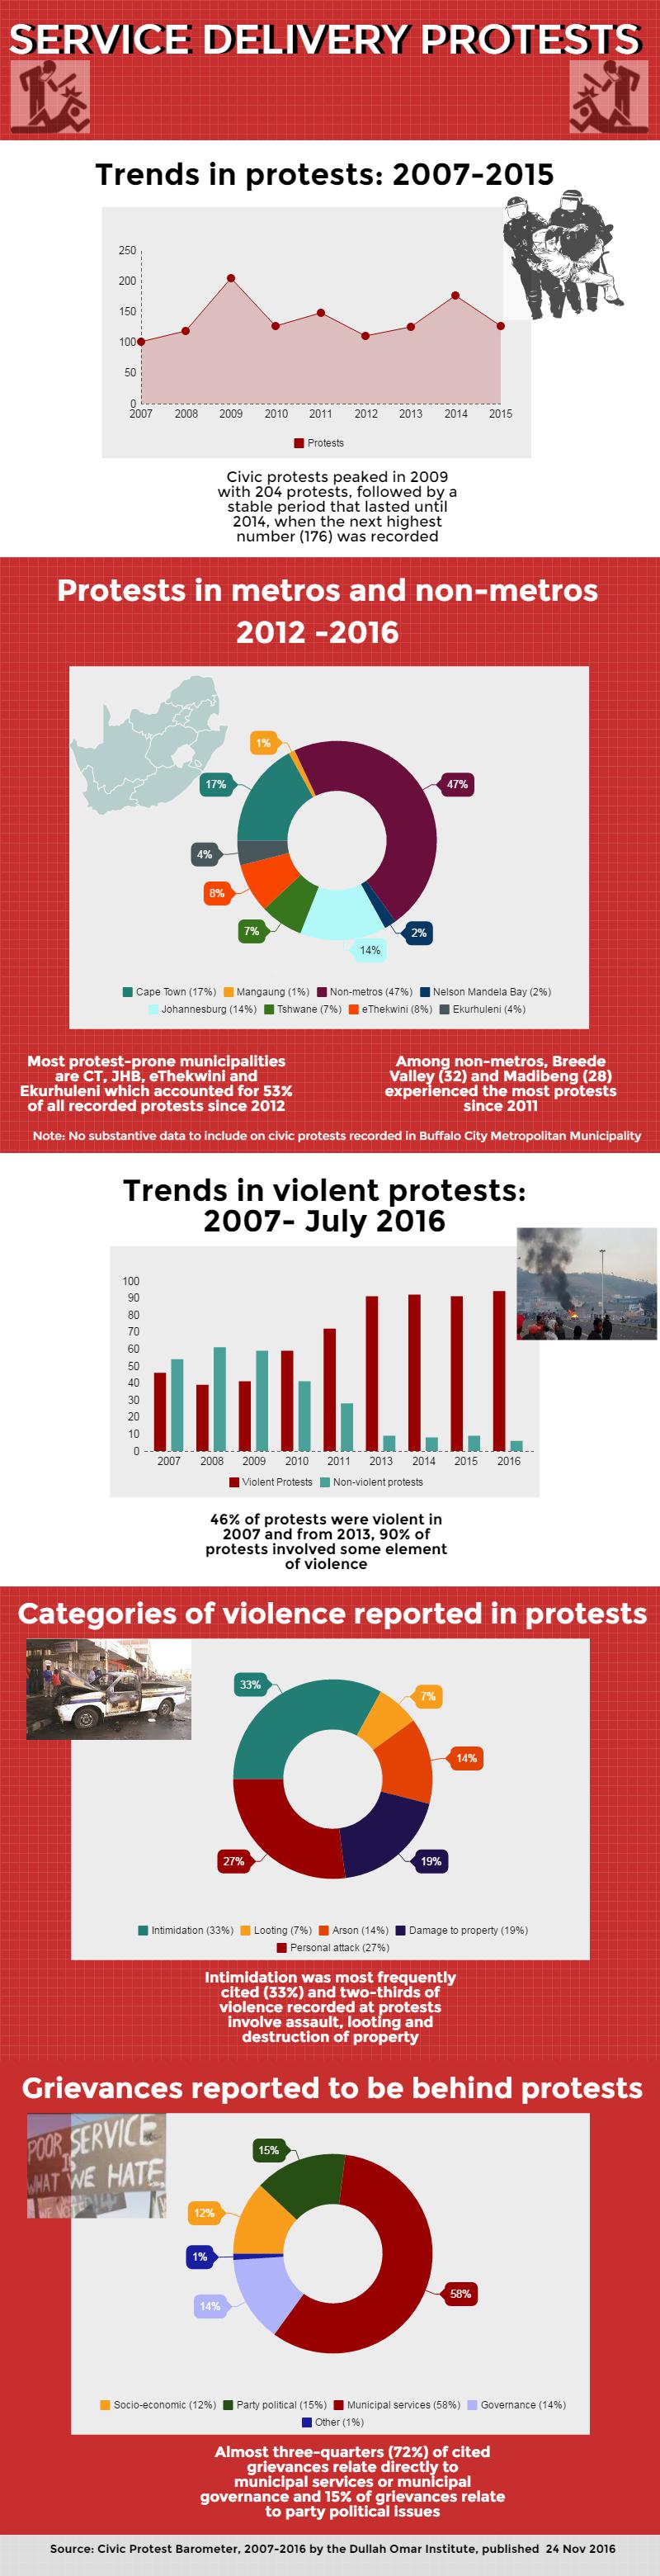
Interesting outcomes include the following:
- In 2009 South Africa experienced a total of 204 civic protests, whereas in 2015 civic protests decreased to 126
- Gauteng is the most protest-prone province in South Africa
- More than half of all protests took place in metropolitan municipalities
- More than 90% of civic protests are associated with violence and intimidation.
See infographic below for more on civic protests:

Comments
Keep comments free of racism, sexism, homophobia and abusive language. People's Assembly reserves the right to delete and edit comments
(For newest comments first please choose 'Newest' from the 'Sort by' dropdown below.)